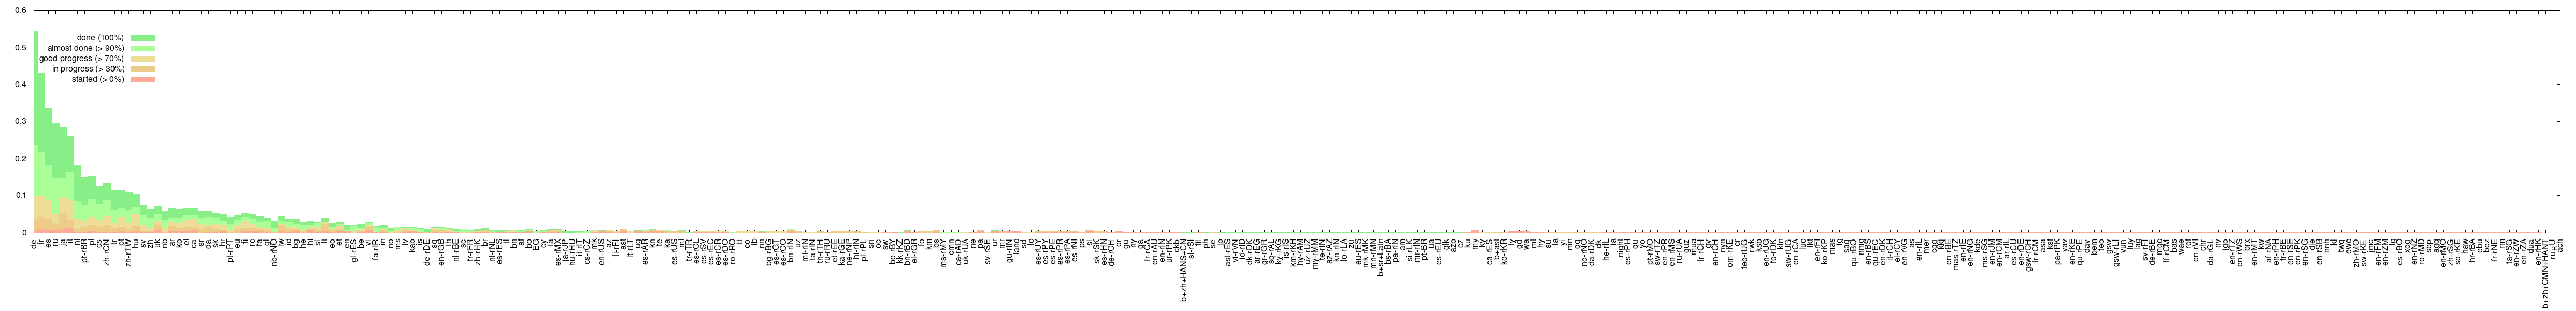
Global report
These graphs represent the state of translation of each language, compared to one another, every day. On the first graph, the Y axis is the percentage of applications translated in the language specified on the X axis, on the total number of apps that have at least one translation. The second graph is the same, but on the total number of app.
Languages are classified with a point system: each language gets one point per completed translation, 0.9 points per almost completed translation, 0.7 points per good progress, 0.3 points per in progress and 0.1 points for started translations.
You can download the raw data, or you might want to visualize them as a big table.

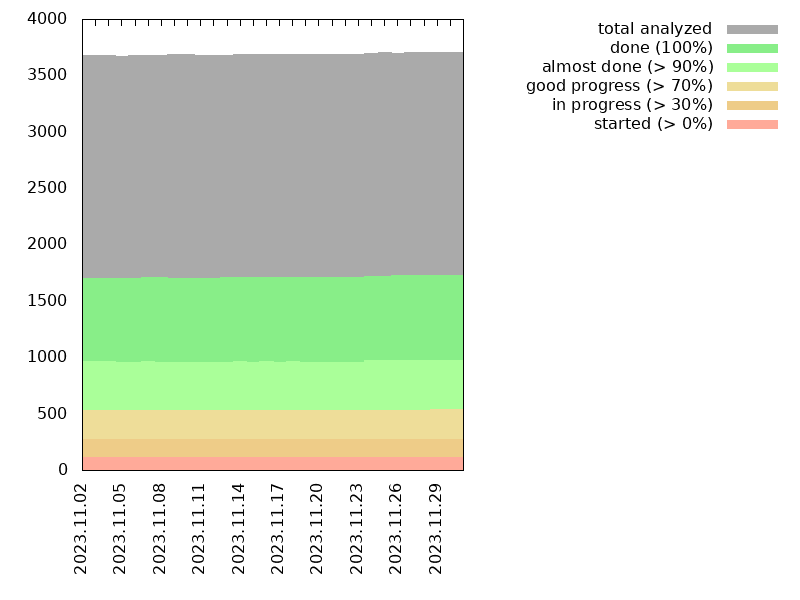
Language evolution
This graph represents the evolution of a specified language, in number of apps in a specific state. A silent bug prevented the analysis to run for a few months, until it was fixed again on February 5, 2020, so the data starts from that time. You can select your language from the list below: